Running Aspire
To run our API through Aspire, we need to run the AppHost project. There are several ways to do this:
Using your IDE:
- In Visual Studio or Visual Studio Code, simply run the AppHost project
- The IDE will build, start, and attach the debugger automatically
Using the .NET CLI:
dotnet run --project src/Dometrain.Aspire.AppHost
Using the Aspire CLI:
aspire run
When you start the AppHost, Aspire will:
- Configure the Aspire environment
- Build the AppHost project and all referenced projects
- Start all defined resources (APIs, databases, caches, etc.)
- Launch the Aspire Dashboard automatically
- Display a list of endpoints in the console
The Aspire Dashboard
The first thing that appears when we run the AppHost is the Aspire Dashboard—a powerful web-based interface for comprehensive app monitoring and inspection.
The Dashboard is built on OpenTelemetry, an open standard for observability. This means it's not .NET-specific and can be used with any OpenTelemetry-enabled application. .NET is deeply integrated with OpenTelemetry, making the dashboard experience seamless.
Key Features
The Aspire Dashboard provides:
- Real-time visibility into logs, traces, and metrics
- Resource management with the ability to view, start, stop, and restart resources
- Environment configuration inspection
- OpenTelemetry compatibility - works with any app using the OpenTelemetry SDK
- AI-powered debugging - GitHub Copilot integration (when available) to help analyze logs and traces
Let's explore the different sections of the dashboard.
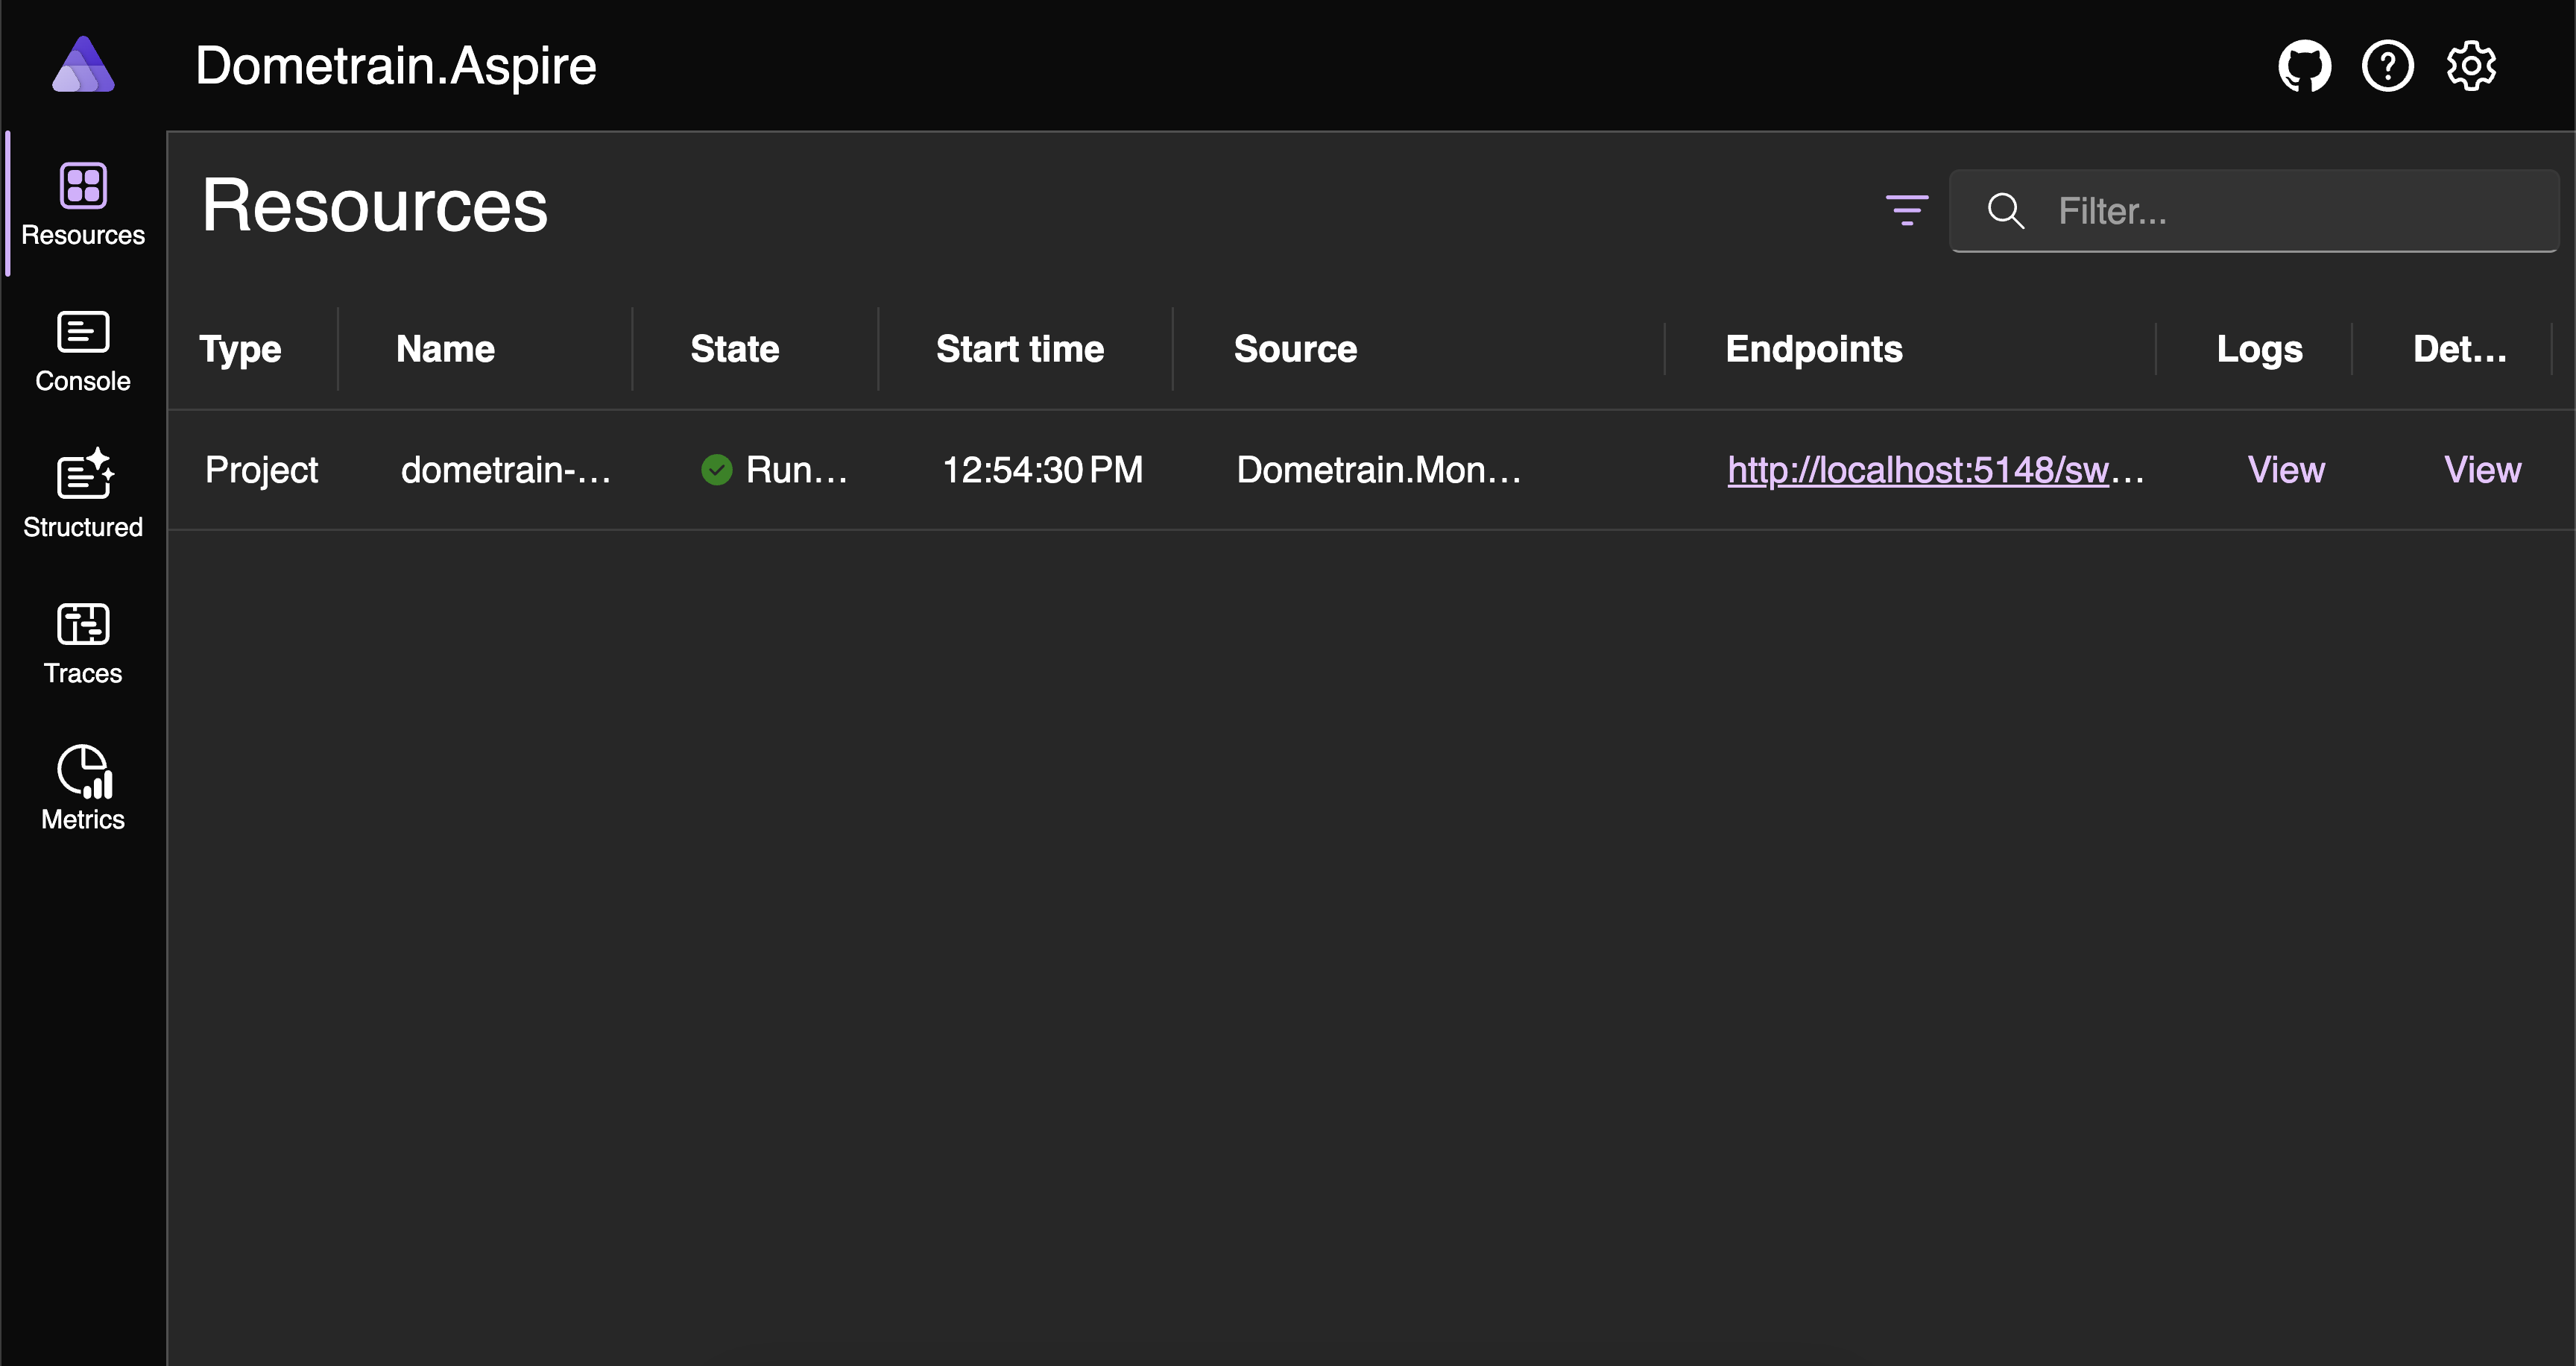
Resources
The Resources page is the main hub of the dashboard, displaying all the resources that make up your distributed system. Resources include:
- Projects: Your .NET applications (APIs, background services, etc.)
- Containers: Docker containers for databases, caches, message brokers
- Executables: External processes
- Cloud resources: Azure services, AWS resources, etc.
For each resource, you can:
- View its current state (running, stopped, failed)
- See environment variables and configuration
- Access console logs
- Navigate to structured logs, traces, and metrics via the Actions menu
- Start, stop, or restart the resource
For now, our dashboard only contains our API, but we'll be adding more resources soon.
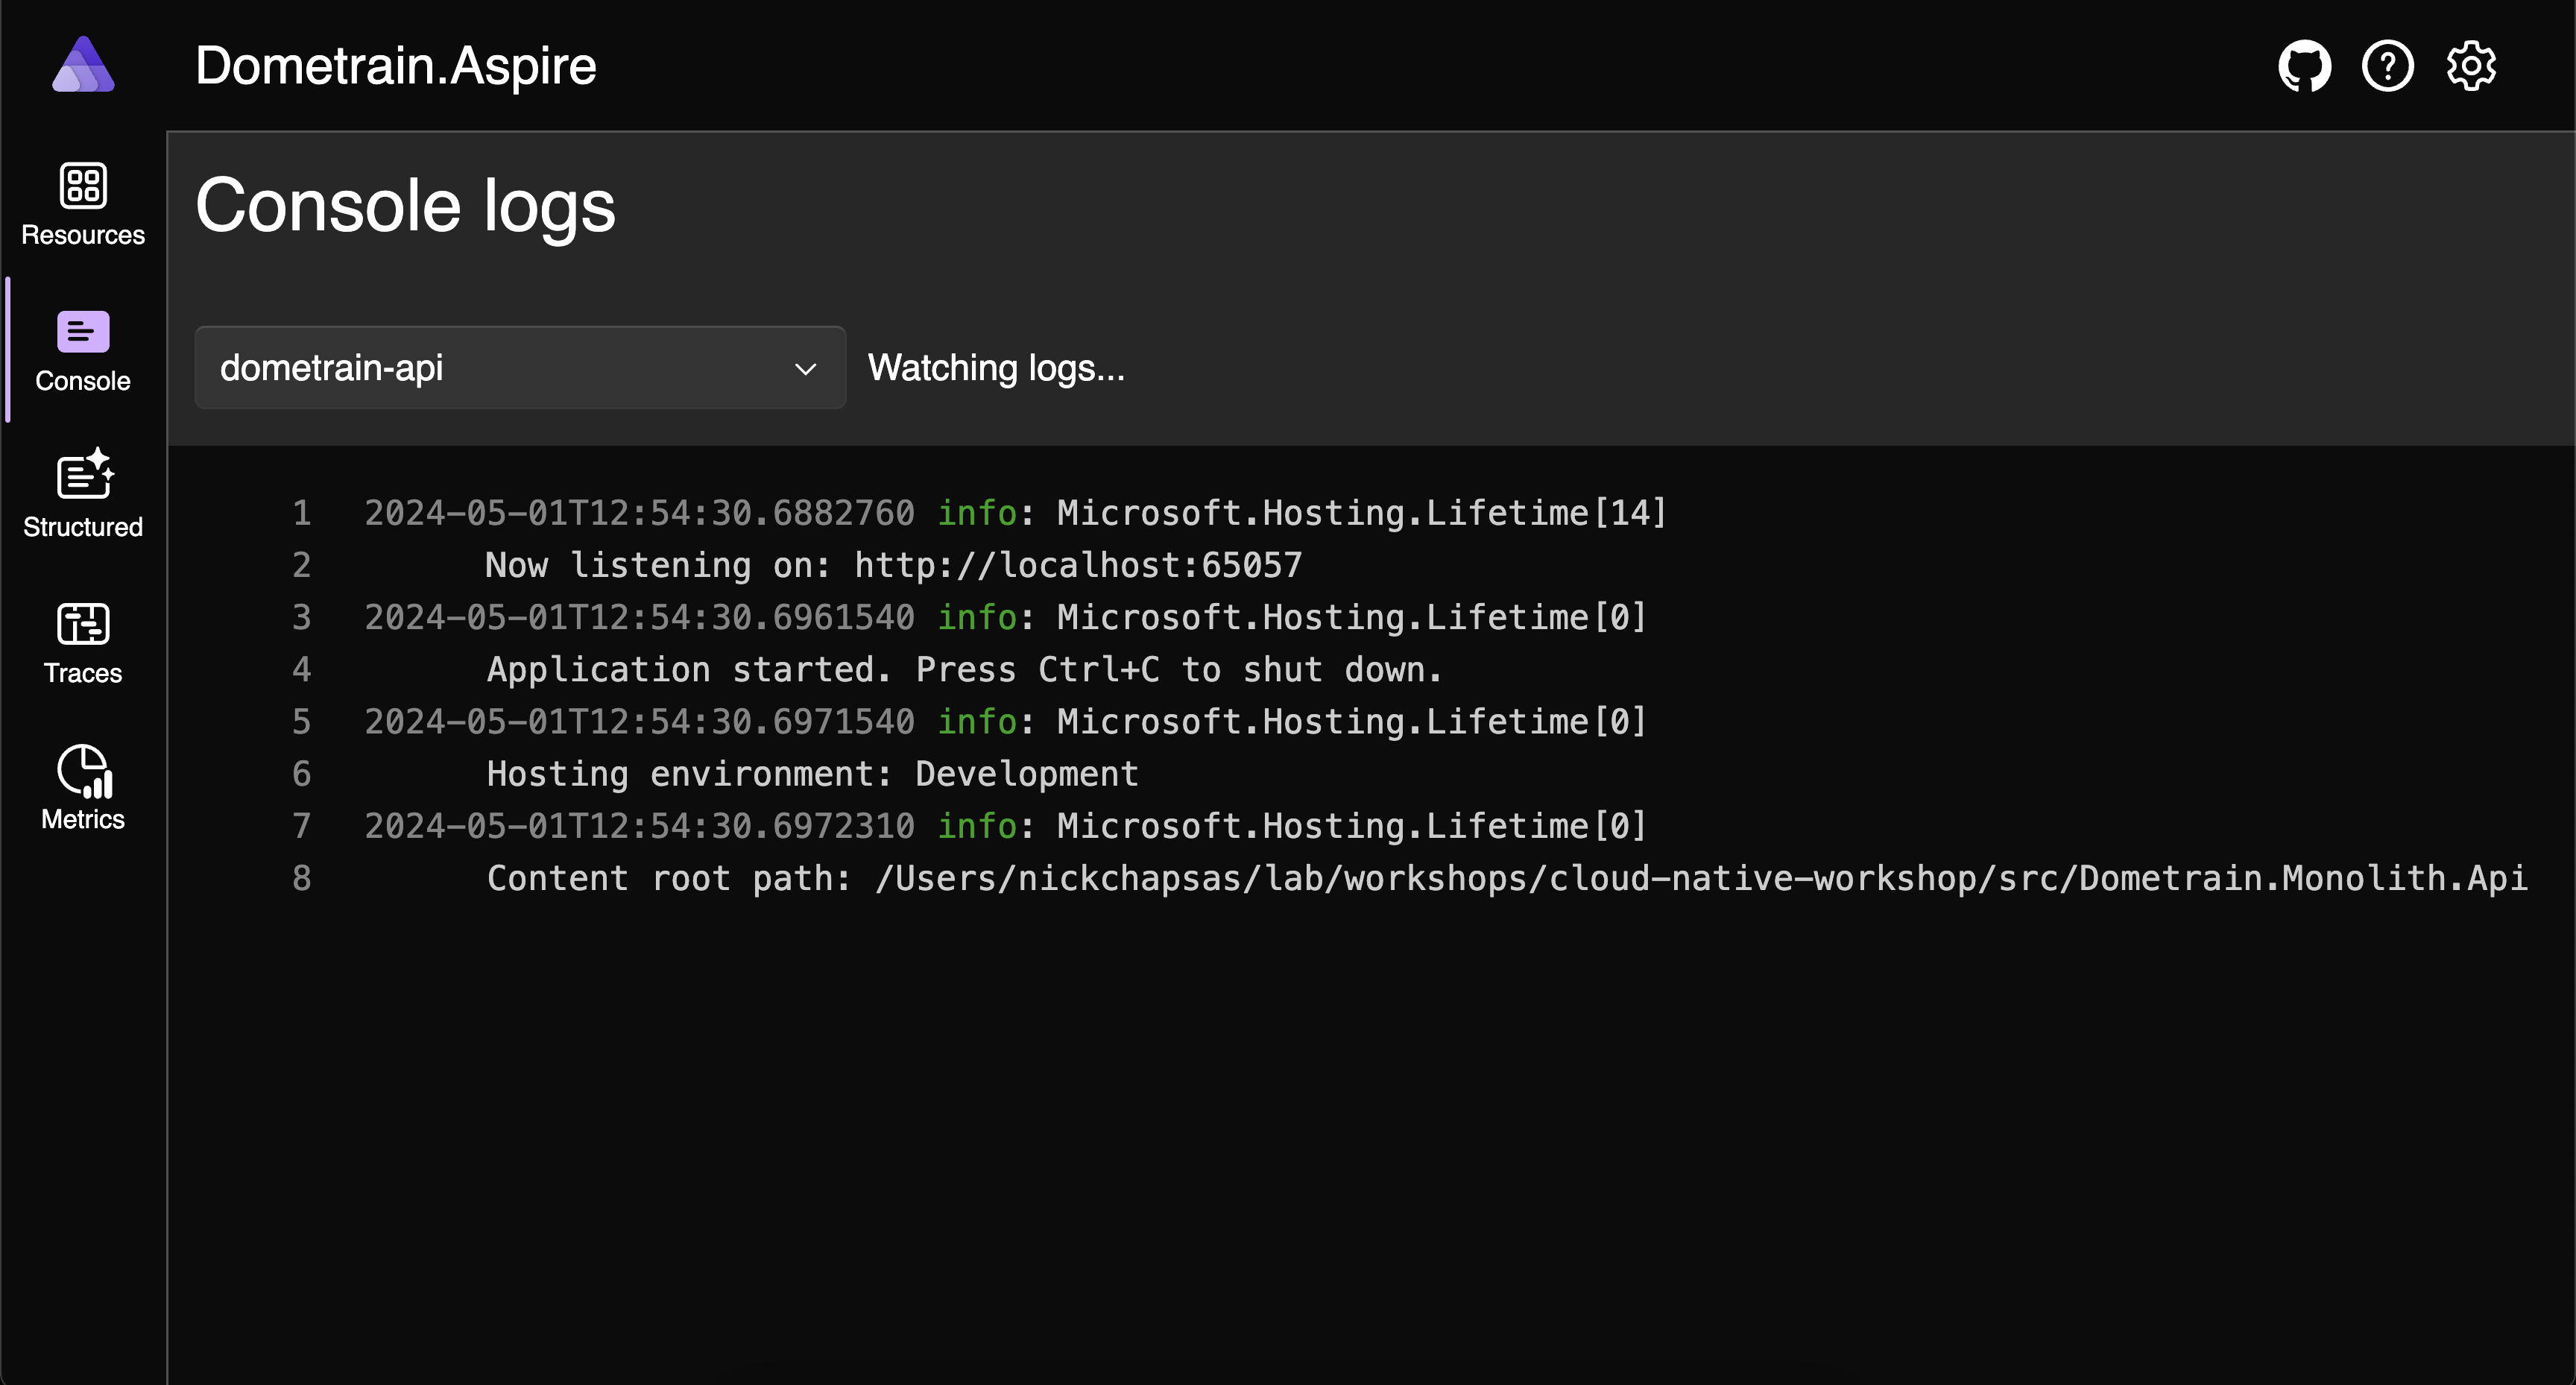
Console Logs
The Console page displays the raw console output from your applications and services. This is useful for:
- Viewing startup messages
- Debugging initialization issues
- Seeing real-time output as it's written to stdout/stderr
- Monitoring background processes
The console logs show exactly what you'd see if you were running the application directly in a terminal. For now, we can only see our application's logs, but as we add more services, each will have its own console output.
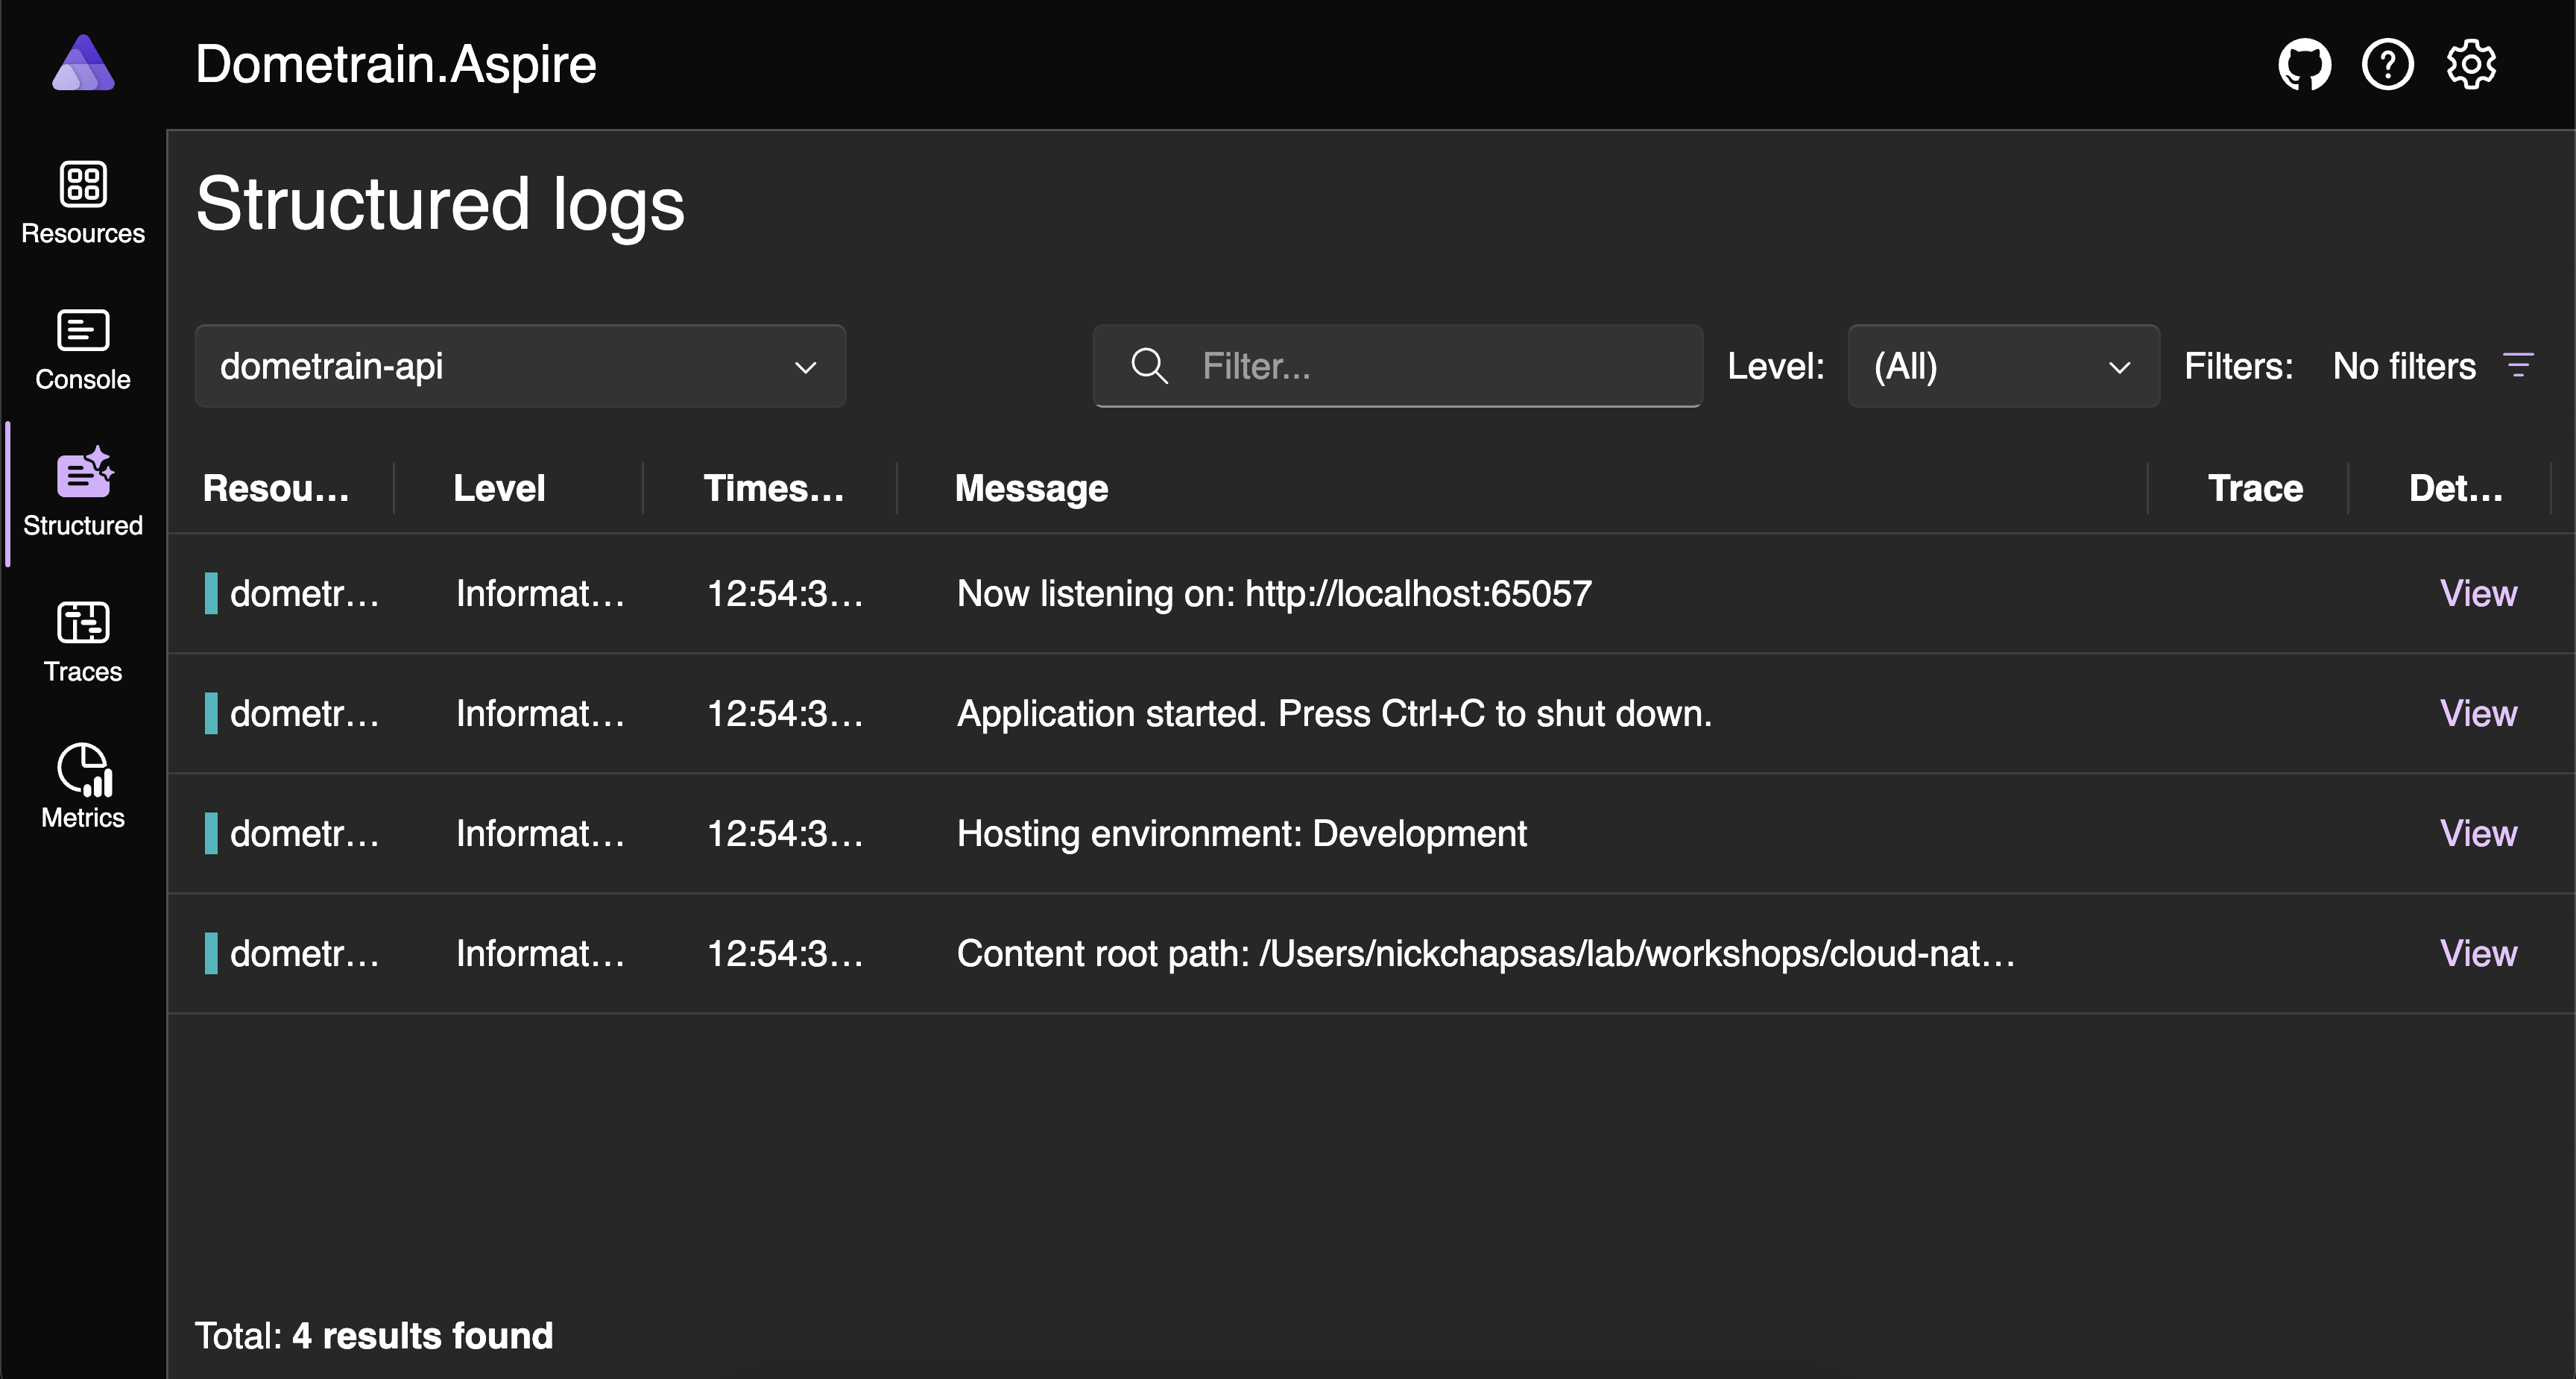
Structured Logs
The Structured Logs page provides a powerful view of your application's logging with rich filtering and search capabilities. Unlike simple console logs, structured logs include:
- Scopes: Logical groupings of related log entries
- Trace and Span IDs: Correlation identifiers that link logs to distributed traces
- Log levels: Information, Warning, Error, Critical, Debug, Trace
- Timestamps: Precise timing information
- Structured data: Key-value pairs attached to each log entry
- Exception details: Full stack traces when errors occur
You can filter by:
- Resource (which application or service)
- Log level
- Time range
- Trace ID (to see all logs related to a specific request)
- Text search
This makes it much easier to diagnose issues across your distributed system, especially when tracking a single request that flows through multiple services.
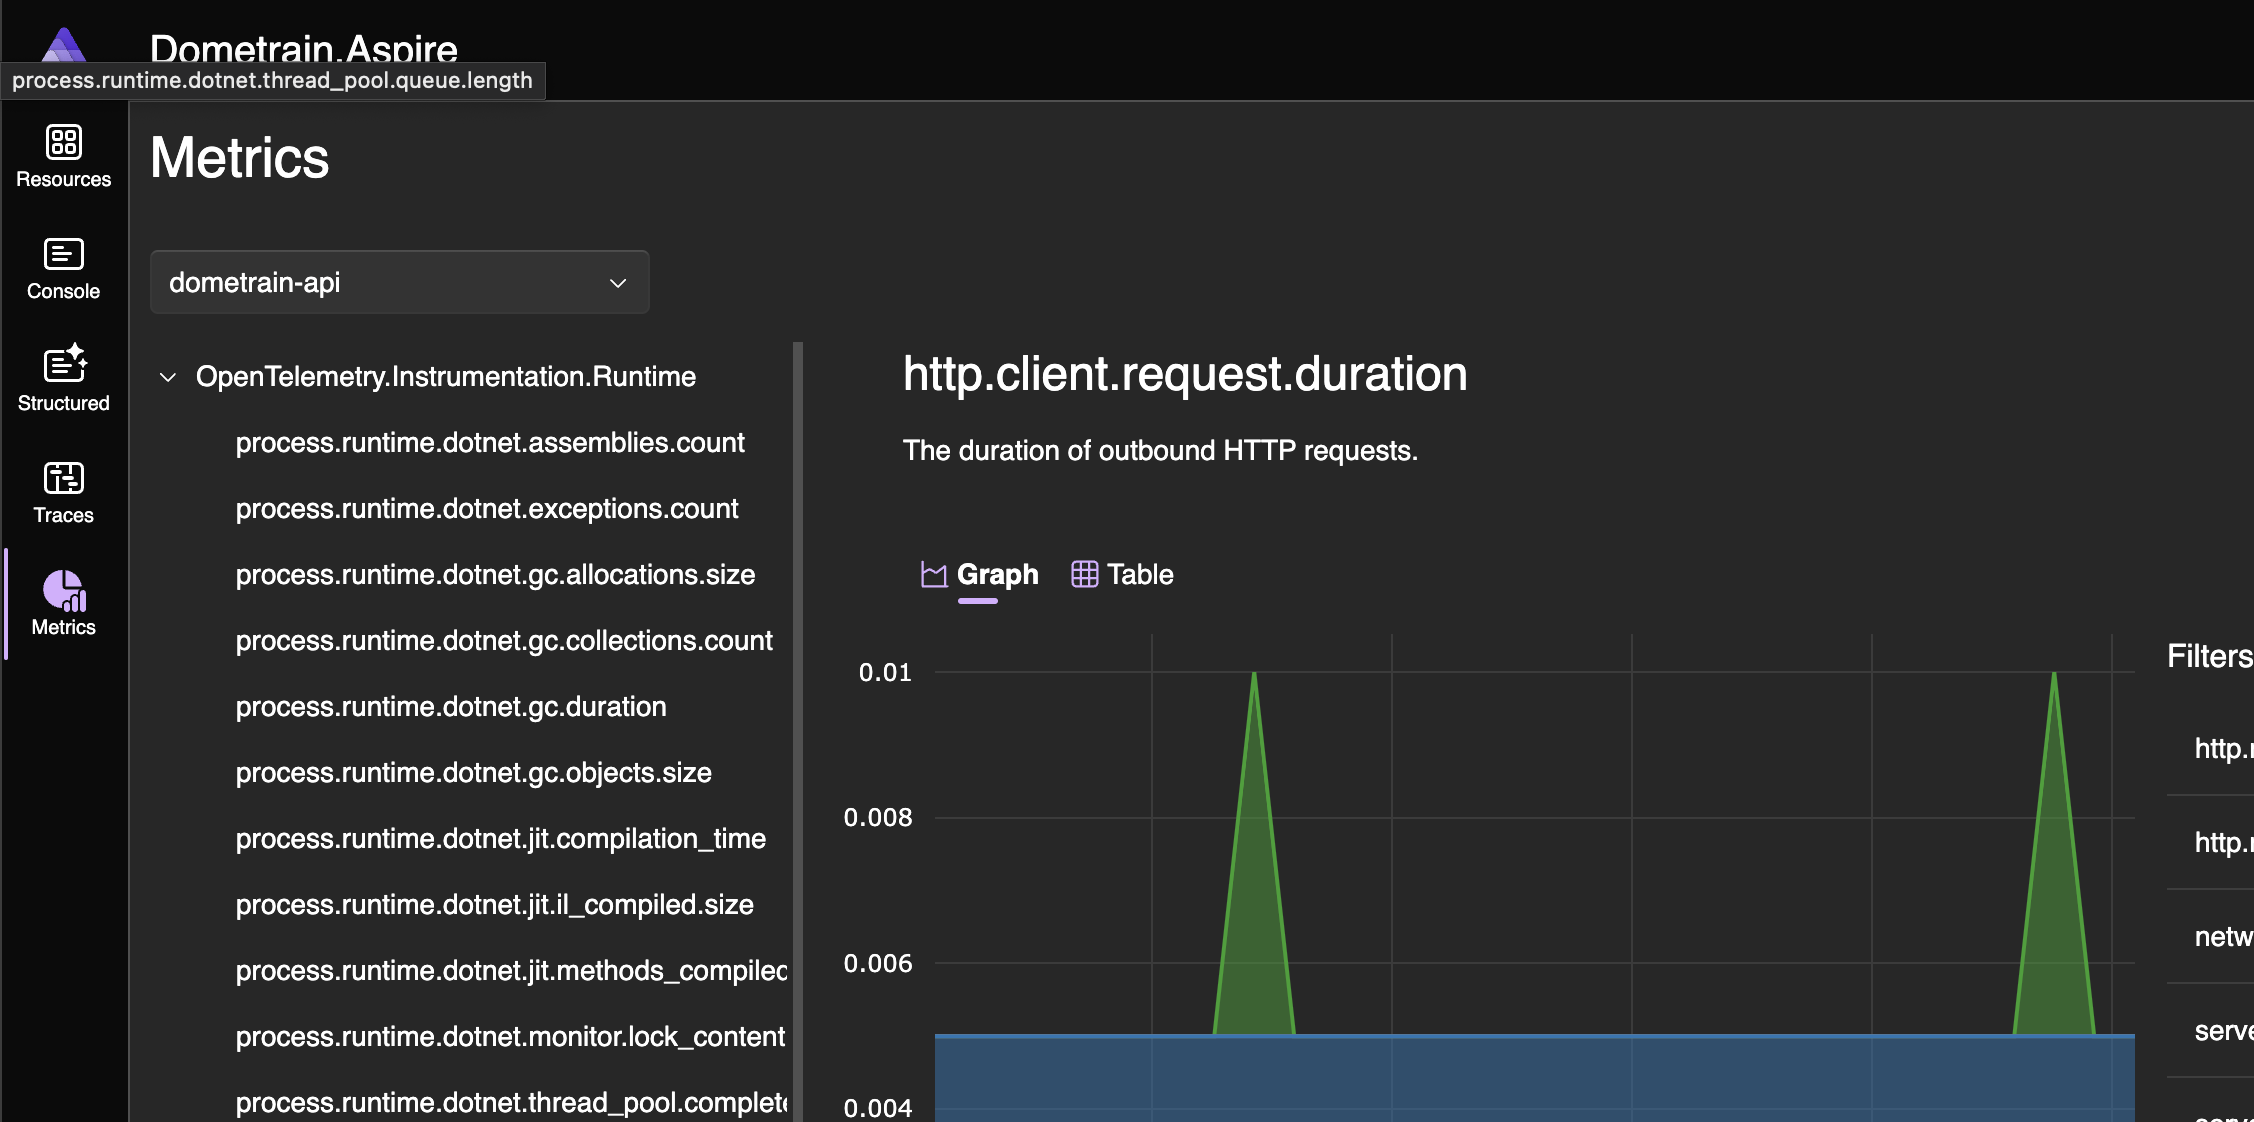
Metrics
The Metrics page allows you to visualize time-series data that your application exposes. Metrics help you understand the performance and health of your system in real-time.
Common metrics include:
- HTTP request duration: How long requests take to process
- Request rate: Requests per second
- Active connections: Current database or cache connections
- Error rates: Failed requests or operations
- CPU and memory usage: Resource consumption
- Custom business metrics: Metrics specific to your application
The dashboard provides interactive charts where you can:
- Select specific metrics to display
- Adjust time ranges
- Compare metrics across different resources
- Zoom in on specific time periods
- Export data for further analysis
These metrics are crucial for identifying performance bottlenecks, capacity planning, and monitoring the overall health of your distributed system.
Traces
The Traces page (available via the navigation menu) shows distributed traces that follow requests as they flow through your system. Traces correlate log events that are part of the same logical activity, even if they're spread across multiple services or processes.
Each trace consists of:
- Spans: Individual operations within the trace
- Duration: How long each operation took
- Relationships: Parent-child relationships between operations
- Attributes: Additional context about each operation
This is invaluable for understanding:
- Where time is spent in a request
- Which services are involved
- Where bottlenecks occur
- How your services communicate
Dashboard as a Standalone Tool
The Aspire Dashboard is also available as a standalone Docker container that can be used with any OpenTelemetry-enabled application, not just Aspire projects. This makes it an excellent development tool even for non-.NET applications or existing systems.
Next Steps
Now that we've seen how to run Aspire and explore the dashboard, let's start adding more infrastructure to our application, beginning with our database.